Welcome to svgdigitizer’s documentation!
The svgdigitizer allows recovering data from a curve in a figure,
plotted in a 2D coordinate system. The data can be recovered from an SVG with a Python API or a command line interface to create figures or frictionless datapackages (CSV and JSON). The svgdigitizer supports units, scalebars, scaling factors, and more.

Features
The svgdigitizer has additional features compared to other plot digitizers:
usage of splines allows for very precise retracing of distinct features
supports multiple y (x) values per x (y) value
supports scale bars
supports scaling factors
supports plots with a skewed axis
splines can be digitized with specific sampling intervals
extracts units from axis labels
extracts metadata associated with the plot in the SVG
reconstruct time series with a given scan rate
saves data as frictionless datapackage (CSV + JSON) allowing for FAIR data usage
inclusion of metadata in the datapackage
Python API to interact with the retraced data
Example Plot
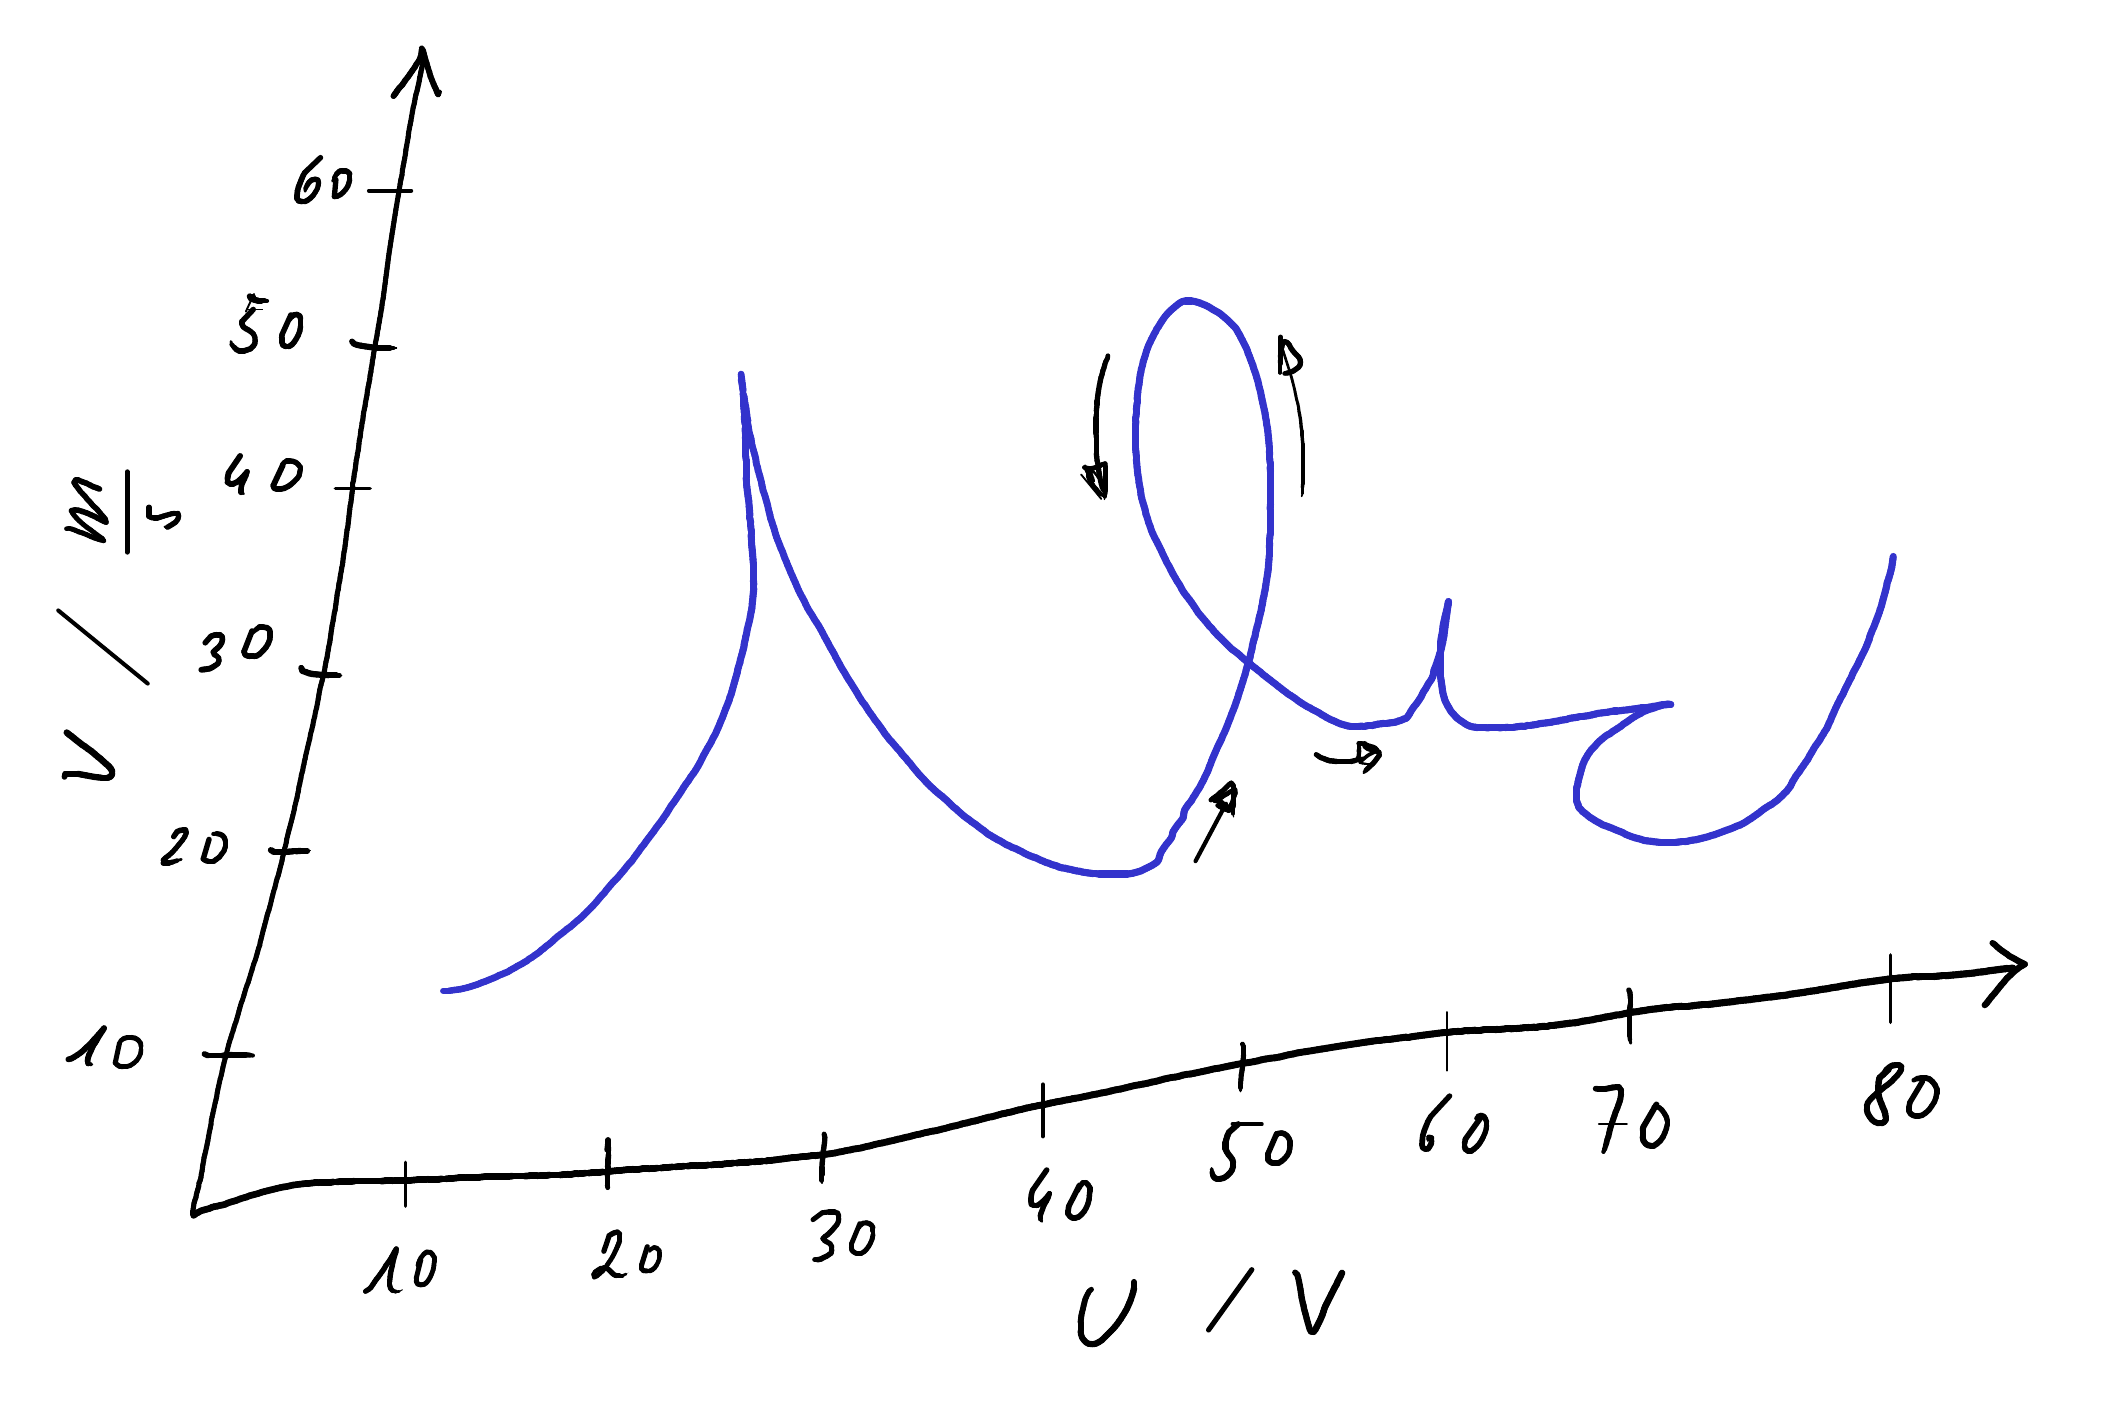
Such plots are often found in scientific publications, where in many cases, especially for old publications, the source data is not accessible anymore. In some cases, the axes of the plot can be skewed, e.g., in scanned documents. An extreme case for such a plot is depicted in the following figure.

In order to recover the source data, first the plot is imported in a
vector graphics program, such as Inkscape to create an SVG file.
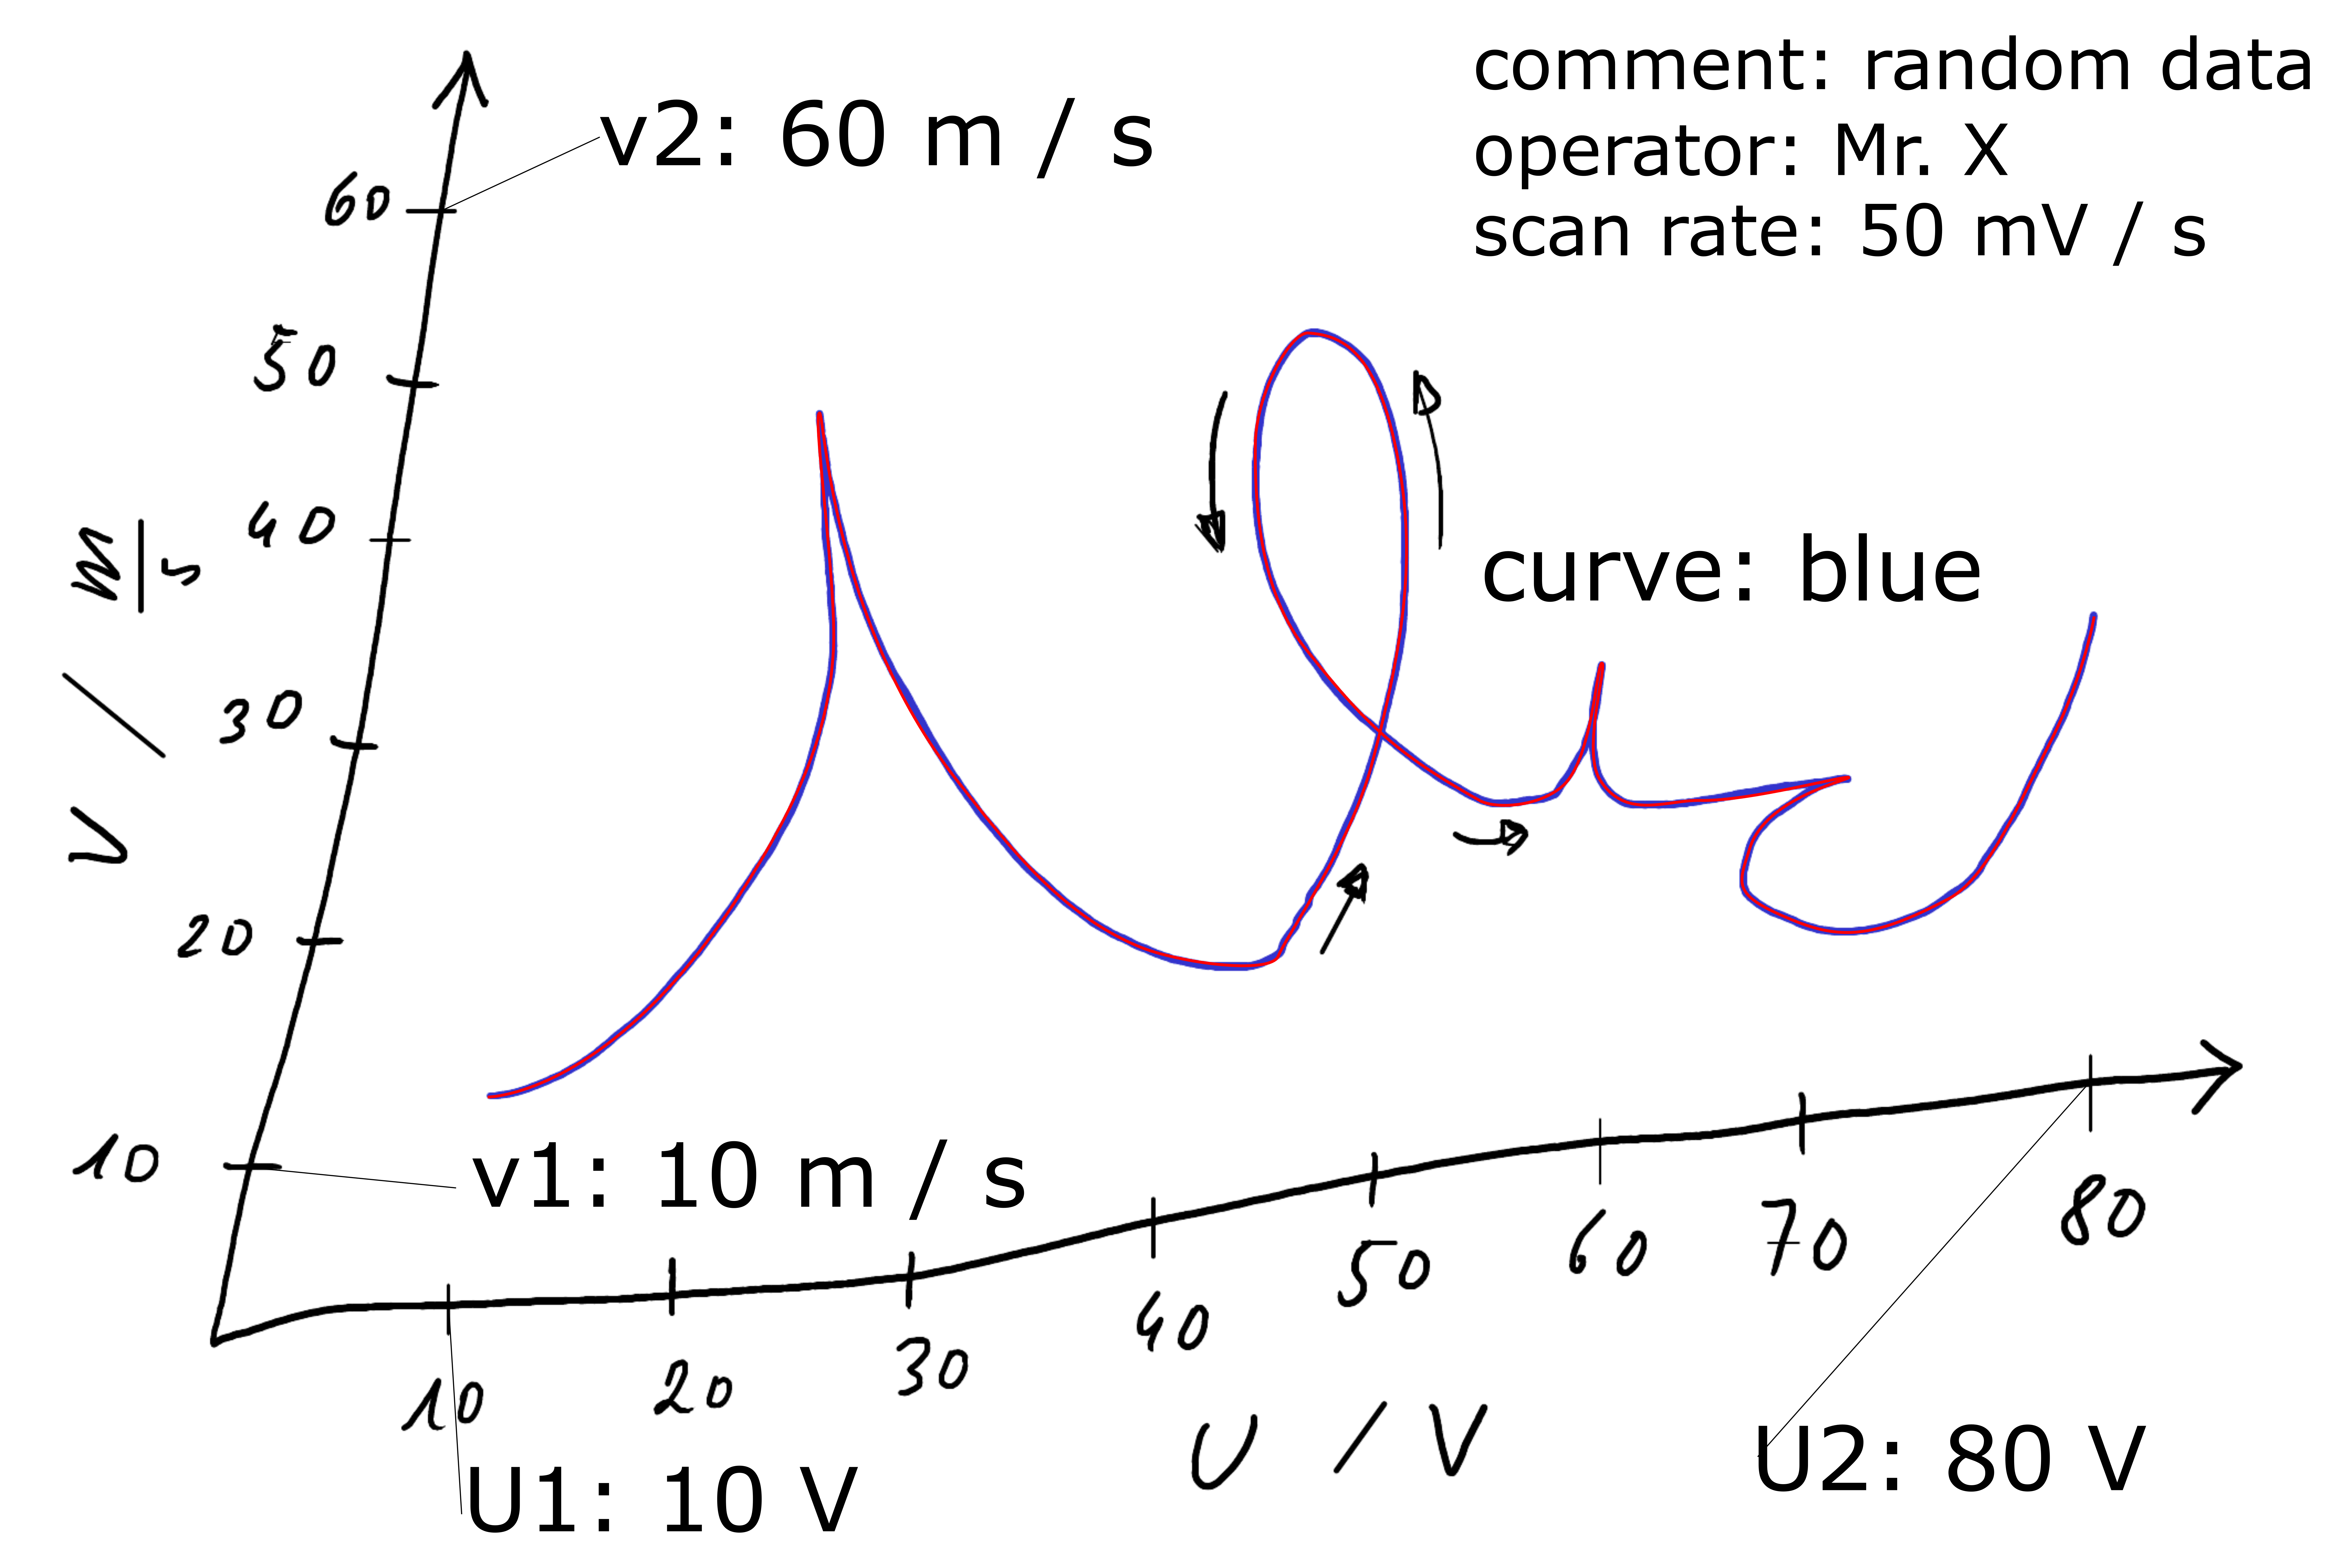
The curve is traced with a regular bezier path and is grouped with a text label containing a unique label.
The coordinate system is defined by groups of two points and text labels for each axis.
A scan rate can be given as text label, where the units of the rate must be equivalent to the unit on the x-axis divided by time, such as 50 mV / s. This allows reconstructing a time axis for inclusion in the CSV file.
Additional labels describing the data
can be provided anywhere in the SVG file. For the above figure the SVG looks as follows.

Command line interface
This SVG can be digitized from the command line interface, which creates a frictionless datapacke including a
CSV of the x and y data (here U and v) and a JSON file with metadata.
The sampling of the bezier paths can be set by --sampling-interval which specifies the sampling interval in x units.
In this specific case also indicate that the axes are --skewed.
svgdigitizer figure example_plot_p0_demo.svg --sampling-interval 0.01 --skewed
API
With the Python API, the SVG can also be used to create an SVGPlot instance to extract basic information.
from svgdigitizer.svg import SVG
from svgdigitizer.svgplot import SVGPlot

plot = SVGPlot(SVG(open('./files/others/example_plot_p0_demo.svg', 'rb')), sampling_interval=0.01, algorithm='mark-aligned')
Now axis labels or any other text label in the SVG can be queried.
plot.axis_labels
{'U': 'V', 'v': 'm / s'}
plot.svg.get_texts()
[<text>curve: blue</text>,
 <text>U2: 80 V</text>,
 <text>U1: 10 V</text>,
 <text>v1: 10 m / s</text>,
 <text>v2: 60 m / s</text>,
 <text>comment: random data</text>,
 <text>operator: Mr. X</text>,
 <text>scan rate: 50 mV / s</text>]
The sampled data can be extracted as a pandas dataframe, where the values are given the original plots units:
plot.df.head()
| U | v | |
|---|---|---|
| 0 | 9.881301 | 12.035193 |
| 1 | 9.891301 | 12.033743 |
| 2 | 9.901301 | 12.032435 |
| 3 | 9.911301 | 12.031220 |
| 4 | 9.921301 | 12.030082 |
The SVGPlot instance can be used be used to create an SVGFigure instance, which, for example, reconstructs the time axis based on the scan rate.
from svgdigitizer.svgfigure import SVGFigure

figure = SVGFigure(plot)
figure.scan_rate # Returns an astropy quantity
And the corresponding data:
figure.df.head()
| t | U | v | |
|---|---|---|---|
| 0 | 0.0 | 9.881301 | 12.035193 |
| 1 | 0.2 | 9.891301 | 12.033743 |
| 2 | 0.4 | 9.901301 | 12.032435 |
| 3 | 0.6 | 9.911301 | 12.031220 |
| 4 | 0.8 | 9.921301 | 12.030082 |
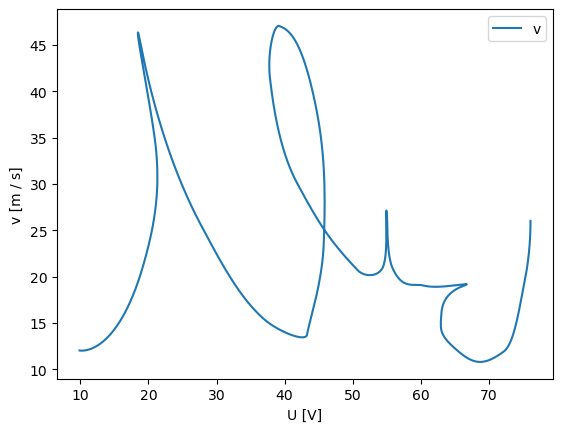
A plot can be created via
figure.plot() # Or plot.plot() for an svgplot instance.

Installation
This package is available on PiPY and can be installed with pip:
pip install svgdigitizer
The package is also available on conda-forge an can be installed with conda
conda install -c conda-forge svgdigitizer
or mamba
mamba install -c conda-forge svgdigitizer
See the installation instructions for further details.
Further information
The svgdigitizer can be enhanced with other modules for specific datasets.
Currently the following datasets are supported:
cyclic voltammograms (I vs. E — current vs. potential curves or j vs. E — current density vs. potential curves) commonly found in electrochemistry. For further details and requirements refer to the specific instructions of the cv module itself or the detailed description on how to digitize cyclic voltammograms for the echemdb.
If you have used this project in the preparation of a publication, please cite it as described on our zenodo page.
Datapackage interaction
Datapackges created with svgplot (or modules inheriting from svgplot such as cv) can be loaded with the ‘unitpackage’ module to create a database of the digitized data. In case your own data has the same datapackage structure, the digitized data can easily be compared with your own data.