API
Modules:
The different modules of svgdigitizer provide access to the elements of an SVG with different complexity to retrace different kinds of plots.
The following provides a brief description of the connection between the modules of svgdigitizer. For more information on the individual modules refer to the respective documentation.
Introduction
First create an SVG object from which you can query certain objects such as the curve.
from svgdigitizer.svg import SVG
from io import StringIO
svg = SVG(StringIO(r'''
 <svg>
   <g>
     <path d="M 0 100 L 100 0" />
     <text x="0" y="0">curve: 0</text>
   </g>
</svg>'''))
svg.get_labeled_paths("curve")
[[Path "curve: 0"]]
The SVG object can be used to create an SVGPlot object, which consists of a curve grouped with a text label, axis
labels grouped with points determining the coordinate system, and (optionally) additional metadata provided as text fields in the SVG. Thus the object has the characteristics of a typical 2D plot found in scientific publications.
From this object one can extract the data as pandas dataframe, get axis labels or create a plot.
from svgdigitizer.svg import SVG
from svgdigitizer.svgplot import SVGPlot
from io import StringIO
svg = SVG(StringIO(r'''
<svg>
  <g>
    <path d="M 0 100 L 100 0" />
    <text x="0" y="0">curve: 0</text>
  </g>
  <g>
    <path d="M 0 200 L 0 100" />
    <text x="0" y="200">x1: 0</text>
  </g>
  <g>
    <path d="M 100 200 L 100 100" />
    <text x="100" y="200">x2: 1</text>
  </g>
  <g>
    <path d="M -100 100 L 0 100" />
    <text x="-100" y="100">y1: 0</text>
  </g>
  <g>
    <path d="M -100 0 L 0 0" />
    <text x="-100" y="0">y2: 1</text>
  </g>
</svg>'''))
plot = SVGPlot(svg)
plot.df
| x | y | |
|---|---|---|
| 0 | 0.0 | 0.0 |
| 1 | 1.0 | 1.0 |
The SVGPlot object can be used to create an SVGFigure object. This object has enhanced functionalities, which allow, for example, extraction of units from the labels, reconstructing a time axis from a given scan rate or returning the data in SI units.
Warning
Conversion into SI units can lead to undesired results. For example, V is eventually transformed by astropy into W / A or A Ohm.
from svgdigitizer.svg import SVG
from svgdigitizer.svgplot import SVGPlot
from svgdigitizer.svgfigure import SVGFigure
from io import StringIO
svg = SVG(StringIO(r'''
<svg>
<g>
<path d="M 0 100 L 100 0" />
<text x="0" y="0">curve: 0</text>
</g>
<g>
<path d="M 0 200 L 0 100" />
<text x="0" y="200">T1: 0 mK</text>
</g>
<g>
<path d="M 100 200 L 100 100" />
<text x="100" y="200">T2: 1 mK</text>
</g>
<g>
<path d="M -100 100 L 0 100" />
<text x="-100" y="100">j1: 0 uA / cm2</text>
</g>
<g>
<path d="M -100 0 L 0 0" />
<text x="-100" y="0">j2: 1 uA / cm2</text>
</g>
<text x="-200" y="330">scan rate: 50 K/s</text>
</svg>'''))
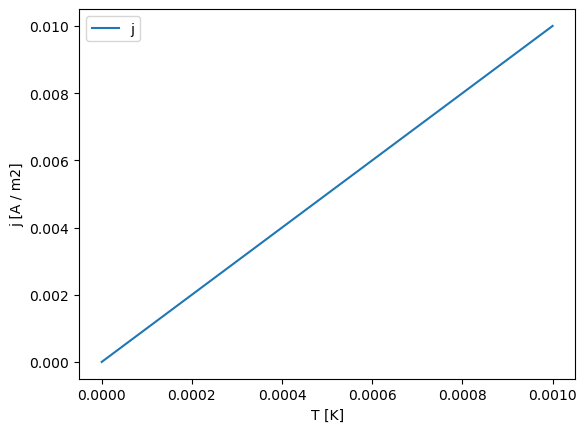
figure = SVGFigure(SVGPlot(svg), force_si_units=True)
figure.plot()
Saving Data
Both for svgplot and svgfigure the data can be stored as CSV, where an
svgplotonly savesxanyyvaluessvgfiguresavesx,y, and a time axist, when a scan rate is provided as text label in the svg.
figure.df.to_csv('figure.csv', index=False)
Warning
The resulting data does not contain any information on the units of the axis. These are accessible via figure.data_schema. If the units were converted to SI, the original units are accessible via figure.figure_schema.
It is recommended to use the CLI to create a datapackage which consists of a CSV and a JSON file (the latter including the axis units).
Special Figures
New modules can be created to retrace specific types of plots, such as cyclic voltammograms (CVs). These modules inherit from SVGFigure.