Usage
The unitpackage module allows interacting with collections and entries from specifically designed frictionless Data Packages.
Collection
A collection can be generated from a remote or a local source.
To illustrate the usage of unitpackage, we create a collection from the entries shown on echemdb.org,
which are retrieved from the data repository:
from unitpackage.collection import Collection
db = Collection.from_remote()
Type db to highlight the entries within the collection or show the number of entries in the collection with.
len(db)
205
The identifiers can also be returned as a list.
Slice the collection
db.identifiers[0:3]
['alves_2011_electrochemistry_6010_f1a_solid',
 'alves_2011_electrochemistry_6010_f2_red',
 'atkin_2009_afm_13266_f4a_solid']
A new collection from an existing collection can be created from a list of selected identifiers
ids_db = db['engstfeld_2018_polycrystalline_17743_f4b_1','alves_2011_electrochemistry_6010_f1a_solid']
ids_db
[Entry('alves_2011_electrochemistry_6010_f1a_solid'), Entry('engstfeld_2018_polycrystalline_17743_f4b_1')]
a list of indices
ids_db = db[0,1]
ids_db
[Entry('alves_2011_electrochemistry_6010_f1a_solid'), Entry('alves_2011_electrochemistry_6010_f2_red')]
or a slice.
sliced_db = db[:2]
sliced_db
[Entry('alves_2011_electrochemistry_6010_f1a_solid'), Entry('alves_2011_electrochemistry_6010_f2_red')]
You can iterate over these entries
next(iter(db))
Entry('alves_2011_electrochemistry_6010_f1a_solid')
The collection can be filtered for specific descriptors, whereby a new collection is created.
Filter the collection
filtered_db = db.filter(lambda entry: entry.echemdb.experimental.tags == ['BCV','HER'])
len(filtered_db)
3
Alternatively parse a custom filter.
def custom_filter(entry):
    for component in entry.echemdb.system.electrolyte.components:
        if 'ClO4' in component.name:
            return True
    return False

filtered_db = db.filter(custom_filter)
len(filtered_db)
127
Rescaling Units in Collections
The collection.rescale method allows you to rescale the units of all entries within a collection at once.
Provide a dict where the key is the field name and the value is the desired unit.
Fields that are not present in an entry are silently ignored for that entry.
rescaled_db = db.rescale({'E': 'mV', 'j': 'uA / cm2'})
rescaled_db[0].fields
No delimiter or candidate_delimiters were provided; using default candidate delimiters for sniffing.
[{'name': 't', 'type': 'number', 'unit': 's'},
 {'name': 'E', 'type': 'number', 'unit': 'mV', 'reference': 'RHE'},
 {'name': 'j', 'type': 'number', 'unit': 'uA / cm2'}]
For more details on rescaling individual entries, see the data section below.
Entry
Each entry consists of descriptors describing the data in the resource of the datapackage. The entry also has additional methods for descriptor representation, data manipulation, and data visualization.
Entries can be selected by their identifier from a collection. For our example database, such identifiers can directly be inferred from echemdb.org/cv for each entry.
entry = db['engstfeld_2018_polycrystalline_17743_f4b_1']
entry
Entry('engstfeld_2018_polycrystalline_17743_f4b_1')
Entries can also be created from their position in the db.
entry_pos = db[0]
entry_pos
Entry('alves_2011_electrochemistry_6010_f1a_solid')
Other approaches to create entries from CSV or pandas dataframes directly are described here.
Metadata
The metadata associated with a unitpackage entry is accessible via entry.metadata.
From an entry such information can be retrieved by entry['key'],
where key is the respective top-level descriptor in the metadata.
Nested descriptors can be accessed with chained bracket or attribute-style access.
entry = db['engstfeld_2018_polycrystalline_17743_f4b_1']
entry['echemdb']['source']['citationKey']
'engstfeld_2018_polycrystalline_17743'
entry.echemdb.source.citationKey
'engstfeld_2018_polycrystalline_17743'
entry.metadata provides a full list of available descriptors. See Creating Unitpackages for details on how to load and modify metadata.
Units and values
Entries containing both a unit and a value are returned as astropy units or quantities.
entry.echemdb.figureDescription.scanRate
50.0 mV / s
The unit and value can be accessed separately
entry.echemdb.figureDescription.scanRate.value
50.0
entry.echemdb.figureDescription.scanRate.unit
'mV / s'
Data
The data can be returned as a pandas dataframe.
entry.df.head()
| t | E | j | |
|---|---|---|---|
| 0 | 0.00 | -0.198005 | 0.036712 |
| 1 | 0.02 | -0.197005 | 0.045084 |
| 2 | 0.04 | -0.196005 | 0.050082 |
| 3 | 0.06 | -0.195005 | 0.054618 |
| 4 | 0.08 | -0.194005 | 0.058966 |
The description of the fields (column names) including units and/or other information are accessible via entry.fields.
entry.fields
[{'name': 't', 'type': 'number', 'unit': 's'},
 {'name': 'E', 'type': 'number', 'unit': 'V', 'reference': 'RHE'},
 {'name': 'j', 'type': 'number', 'unit': 'A / m2'}]
Data manipulation
The units of the dataframe can be rescaled to different convertible units.
rescaled_entry = entry.rescale({'t' : 'h', 'E': 'mV', 'j' : 'uA / cm2'})
rescaled_entry.df.head()
| t | E | j | |
|---|---|---|---|
| 0 | 0.000000 | -198.005384 | 3.671208 |
| 1 | 0.000006 | -197.005384 | 4.508403 |
| 2 | 0.000011 | -196.005384 | 5.008222 |
| 3 | 0.000017 | -195.005384 | 5.461767 |
| 4 | 0.000022 | -194.005384 | 5.896625 |
The units are updated in the field descriptions.
rescaled_entry.fields
[{'name': 't', 'type': 'number', 'unit': 'h'},
 {'name': 'E', 'type': 'number', 'unit': 'mV', 'reference': 'RHE'},
 {'name': 'j', 'type': 'number', 'unit': 'uA / cm2'}]
An offset can be applied to a certain axis.
offset_entry = entry.add_offset('E', 0.32, 'V')
offset_entry.df.head()
| t | E | j | |
|---|---|---|---|
| 0 | 0.00 | 0.121995 | 0.036712 |
| 1 | 0.02 | 0.122995 | 0.045084 |
| 2 | 0.04 | 0.123995 | 0.050082 |
| 3 | 0.06 | 0.124995 | 0.054618 |
| 4 | 0.08 | 0.125995 | 0.058966 |
The offset is indicated in the field descriptions. For subsequent offsets, the value is updated.
offset_entry.resource.schema.get_field('E')
{'name': 'E',
 'type': 'number',
 'unit': 'V',
 'reference': 'RHE',
 'offset': {'value': 0.32, 'unit': 'V'}}
A scaling factor can be applied to multiply a column by a given value.
scaled_entry = entry.apply_scaling_factor('j', 2)
scaled_entry.df.head()
| t | E | j | |
|---|---|---|---|
| 0 | 0.00 | -0.198005 | 0.073424 |
| 1 | 0.02 | -0.197005 | 0.090168 |
| 2 | 0.04 | -0.196005 | 0.100164 |
| 3 | 0.06 | -0.195005 | 0.109235 |
| 4 | 0.08 | -0.194005 | 0.117933 |
The scaling factor is tracked in the field descriptions. For subsequent scaling factors, the cumulative value is stored.
scaled_entry.resource.schema.get_field('j')
{'name': 'j',
 'type': 'number',
 'unit': 'A / m2',
 'scalingFactor': {'value': 2.0}}
To add a computed column with proper field descriptions, use entry.add_columns().
This ensures that the field metadata (such as units) is tracked correctly.
import pandas as pd
import astropy.units as u

df = pd.DataFrame()
df['P/A'] = entry.df['E'] * entry.df['j']

new_field_unit = u.Unit(entry.field_unit('E')) * u.Unit(entry.field_unit('j'))
new_entry = entry.add_columns(df['P/A'], new_fields=[{'name':'P/A', 'unit': new_field_unit}])
new_entry.df.head()
| t | E | j | P/A | |
|---|---|---|---|---|
| 0 | 0.00 | -0.198005 | 0.036712 | -0.007269 |
| 1 | 0.02 | -0.197005 | 0.045084 | -0.008882 |
| 2 | 0.04 | -0.196005 | 0.050082 | -0.009816 |
| 3 | 0.06 | -0.195005 | 0.054618 | -0.010651 |
| 4 | 0.08 | -0.194005 | 0.058966 | -0.011440 |
The new field is now included in the field descriptions.
new_entry.fields
[{'name': 't', 'type': 'number', 'unit': 's'},
 {'name': 'E', 'type': 'number', 'unit': 'V', 'reference': 'RHE'},
 {'name': 'j', 'type': 'number', 'unit': 'A / m2'},
 {'name': 'P/A', 'type': 'string', 'unit': Unit("A V / m2")}]
Columns can also be removed with entry.remove_column().
reduced_entry = new_entry.remove_column('P/A')
reduced_entry.fields
[{'name': 't', 'type': 'number', 'unit': 's'},
 {'name': 'E', 'type': 'number', 'unit': 'V', 'reference': 'RHE'},
 {'name': 'j', 'type': 'number', 'unit': 'A / m2'}]
reduced_entry.df.head()
| t | E | j | |
|---|---|---|---|
| 0 | 0.00 | -0.198005 | 0.036712 |
| 1 | 0.02 | -0.197005 | 0.045084 |
| 2 | 0.04 | -0.196005 | 0.050082 |
| 3 | 0.06 | -0.195005 | 0.054618 |
| 4 | 0.08 | -0.194005 | 0.058966 |
Column information
The units of a specific field can be retrieved.
rescaled_entry.field_unit('E')
'mV'
Plotting
The data can be visualized in a plotly figure. Without providing the dimensions of the x any y labels specifically the first two columns are plotted against each other or you can specify the dimensions.
entry.plot()
The dimensions of the axis can be specified explicitly.
entry.plot(x_label='t', y_label='j')
A plot with rescaled axis is obtained by rescaling the entry first.
entry.rescale({'E':'mV', 'j':'uA / cm2'}).plot(x_label='t', y_label='j')
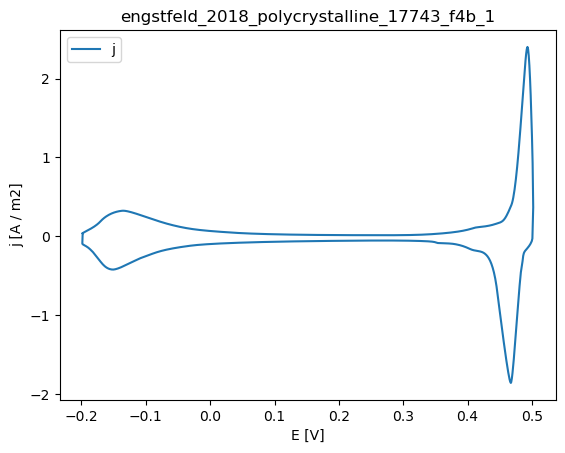
We can also use the matplotlib interface.
import matplotlib.pyplot as plt

fig, ax = plt.subplots(1,1)

x = 'E'
y = 'j'

entry.df.plot(x, y, ax=ax)
plt.title(entry.identifier)
ax.set_xlabel(f"{x} [{entry.field_unit(x)}]")
ax.set_ylabel(f"{y} [{entry.field_unit(y)}]")
Text(0, 0.5, 'j [A / m2]')